How to Technically Trade Cryptocurrencies

Assets are primarily driven by bouts of extreme optimism and pessimism.
And if we can spot these extreme instances the higher the likelihood for success.
Even Warren Buffett will tell you that. “Be fearful when others are greedy and greedy when others are fearful,” he says.
Sir John Templeton would even advise to “buy extreme pessimism.”
It’s part of the reason they became as wealthy as they did. They waited for points of excessive fear and greed… and pounced on the opportunity.
Not only can we use that method with stocks, indexes and ETFs, we can use it with cryptocurrencies, as well. All we have to do is pay attention to the rubber band.
Just like a stock, think of a crypto like a rubber band.
It can only be pulled so far in one direction before it snaps back.
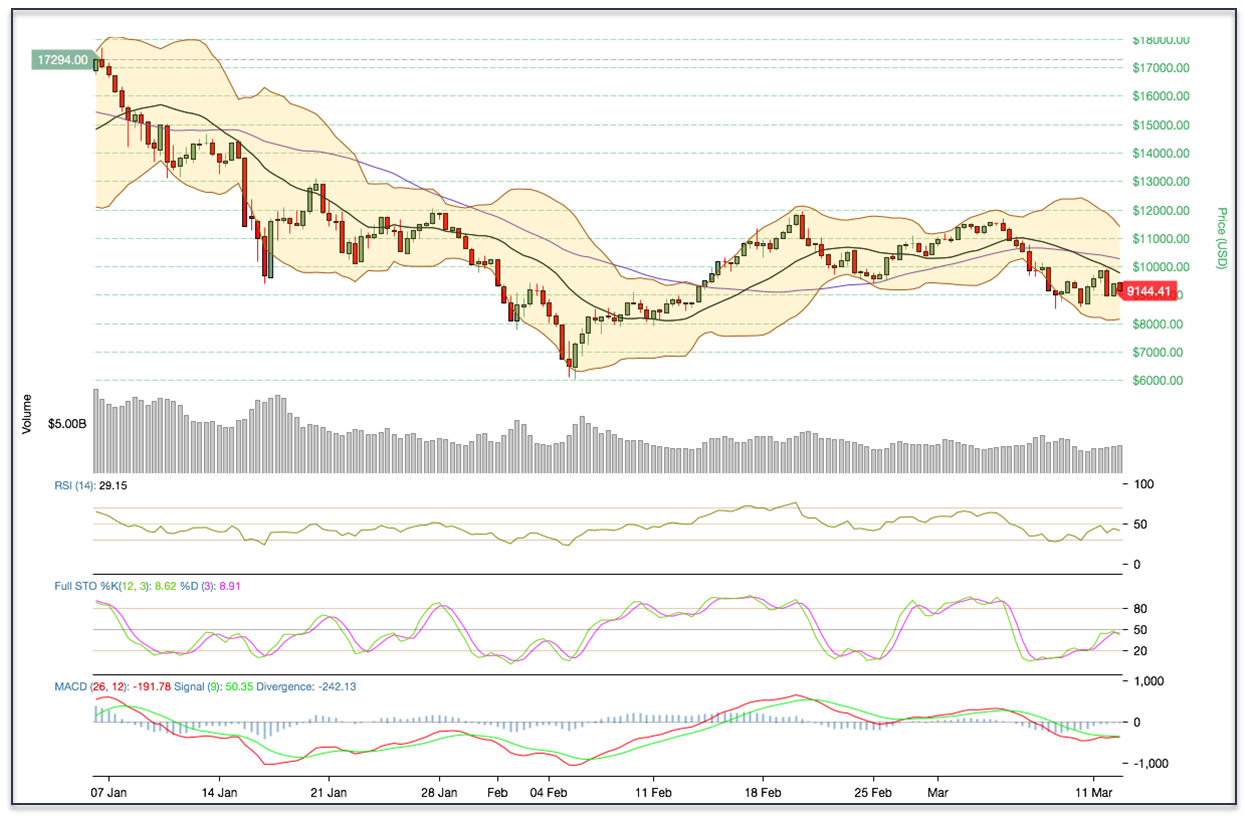
Let’s highlight using Bitcoin, for example.

Free “dummies guide” to trading options
Did you know trading options can actually be safer and more profitable than buying and selling stocks?
Best-selling author reveals his simple & safe way to start trading options in this FREE GUIDE. It’s 100% free until the end of the month.
Our overlays here include the Bollinger Bands (2,20), relative strength (RSI), and Full Stochastic on a year-to-date chart. Notice what happens about 80% of the time when the upper or lower Bollinger Band is touched or penetrated.
You can actually see the points at which the rubber band has been pulled too tight.
Soon after, the coin begins to pivot in the other direction.
Then again, we never want to rely on a sole indicator as a buy or sell trigger. We can also confirm our findings with relative strength. In fact, take a look at what happens to the value of the coin when RSI falls to its 20-line, as the lower Bollinger Band is challenged.
We can then strengthen our finding with full stochastic at or below its 20-line.
Using these three indicators on this chart, we can spot instances of extreme optimism and pessimism about 80% of the time.
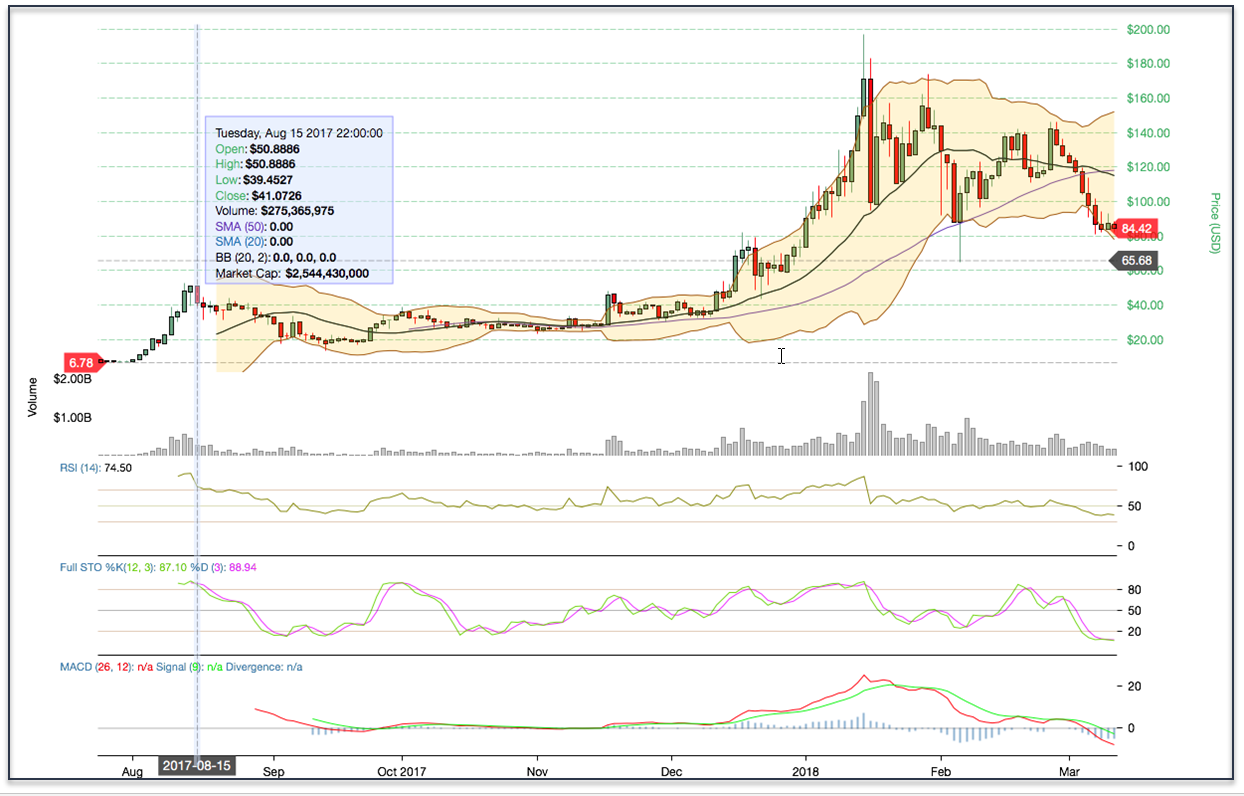
We can seem similar moves in a longer chart as well.
In fact, we can see the same patterns if we look at NEO since December 2017. Most times, as the upper or lower Band is challenged, coupled wit confirmation of an oversold or overbought read from relative strength and fast stochastic, the coin will pivot.
Again, you can clearly see where the rubber band has been pulled far too tight.

However, keep this in mind.
As with any technical pivot point tools, there is no such thing as the Holy Grail of spotting opportunity. However, we do believe the technical tools we’ve shared here may be of assistance. It’s just something to keep in mind, as you trade.
Bonus Report: Can you really Control 100 shares of AAPL for less than $20 bucks? That’s the power of trading options. In the past, trading options was risky or confusing. Not anymore. This guide – Simple Options Trading For Beginners – reveals a safe, simple and sane way to trade options. Perfect for beginners.
